
Search
Search Results
Worksheet/Activity
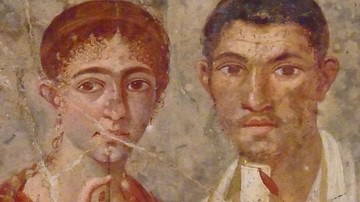
Roman Society - Text & Chart
This activity has been designed to fit a 20-minute slot for your class. Students have to complete a pyramid chart, based on a text. It is part of our Ancient Rome Society and Government pack where you can find: Complete lesson plans...
Worksheet/Activity
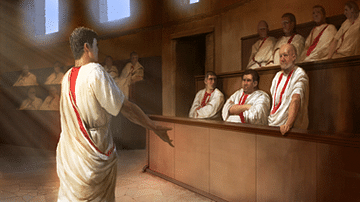
Roman Elections - Video & Chart
This activity has been designed to fit a 20-minute slot for your class. Students have to complete a pyramid chart, based on a video. It is part of our Ancient Rome Society and Government pack where you can find: Complete lesson plans...
Image
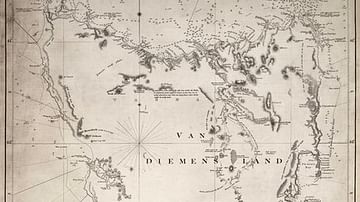
Chart of Van Diemen's Land
Chart of Van Diemen's Land (Tasmania) by the British navigator and cartographer, Matthew Flinders, (1774-1814). Chart drawn 1798-1799.
Image
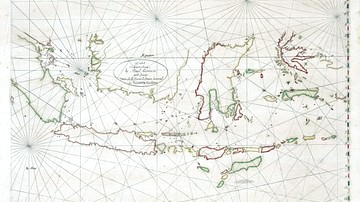
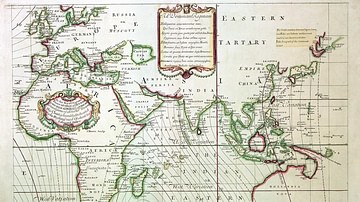
Chart of the Malay Archipelago and the Dutch Discoveries in Australia
Chart of the Malay Archipelago and the Dutch discoveries in Australia by Dutch cartographer Hessel Gerritsz (1581–1632).
Article
The Dutch Discovery of Australia
17th-century Dutch East India Company (Vereenigde Oostindische Compagnie or VOC) navigators were the first Europeans to set foot on Australian soil. Although there is a strong theory that the Portuguese explorer, Cristóvão de Mendonça (1475-1532...
Image
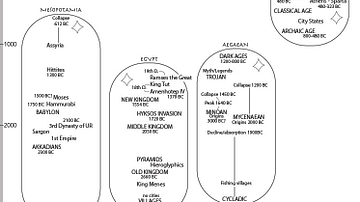
Ancient World Time Chart
A traditional depiction of the major events of the ancient world (Mesopotamia through the Greeks).
Image
Magnetic Sea Chart by Halley
A detail of a chart showing lines of magnetic compass variation made in 1702 by the English scientist and cartographer Edmond Halley (1656-1742). Halley hoped the chart would aid navigation but the variations in magnetism over time made it...
Image
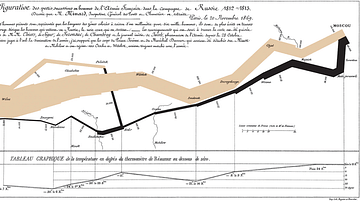
Chart Showing the Number of Men in Napoleon's Russian Campaign of 1812
Charles Minard's famous 1869 chart detailing the number of men in Napoleon's Grande Armée during his 1812 invasion of Russia; the tan represents the men who invaded Russia itself, while the black represents the retreat from Moscow. The way...
Definition
Edmond Halley
Edmond Halley (1656-1742) was an English astronomer, mathematician, and cartographer. Halley's Comet is named after him since he accurately predicted its return in 1758. One of the early globetrotting scientists, Halley led several maritime...
Image
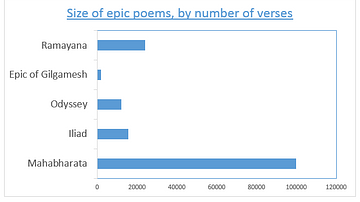
Comparative Bar Chart of Ancient Epics
Size of some of the epic poems of the ancient world, reckoned by the number of lines they contain.