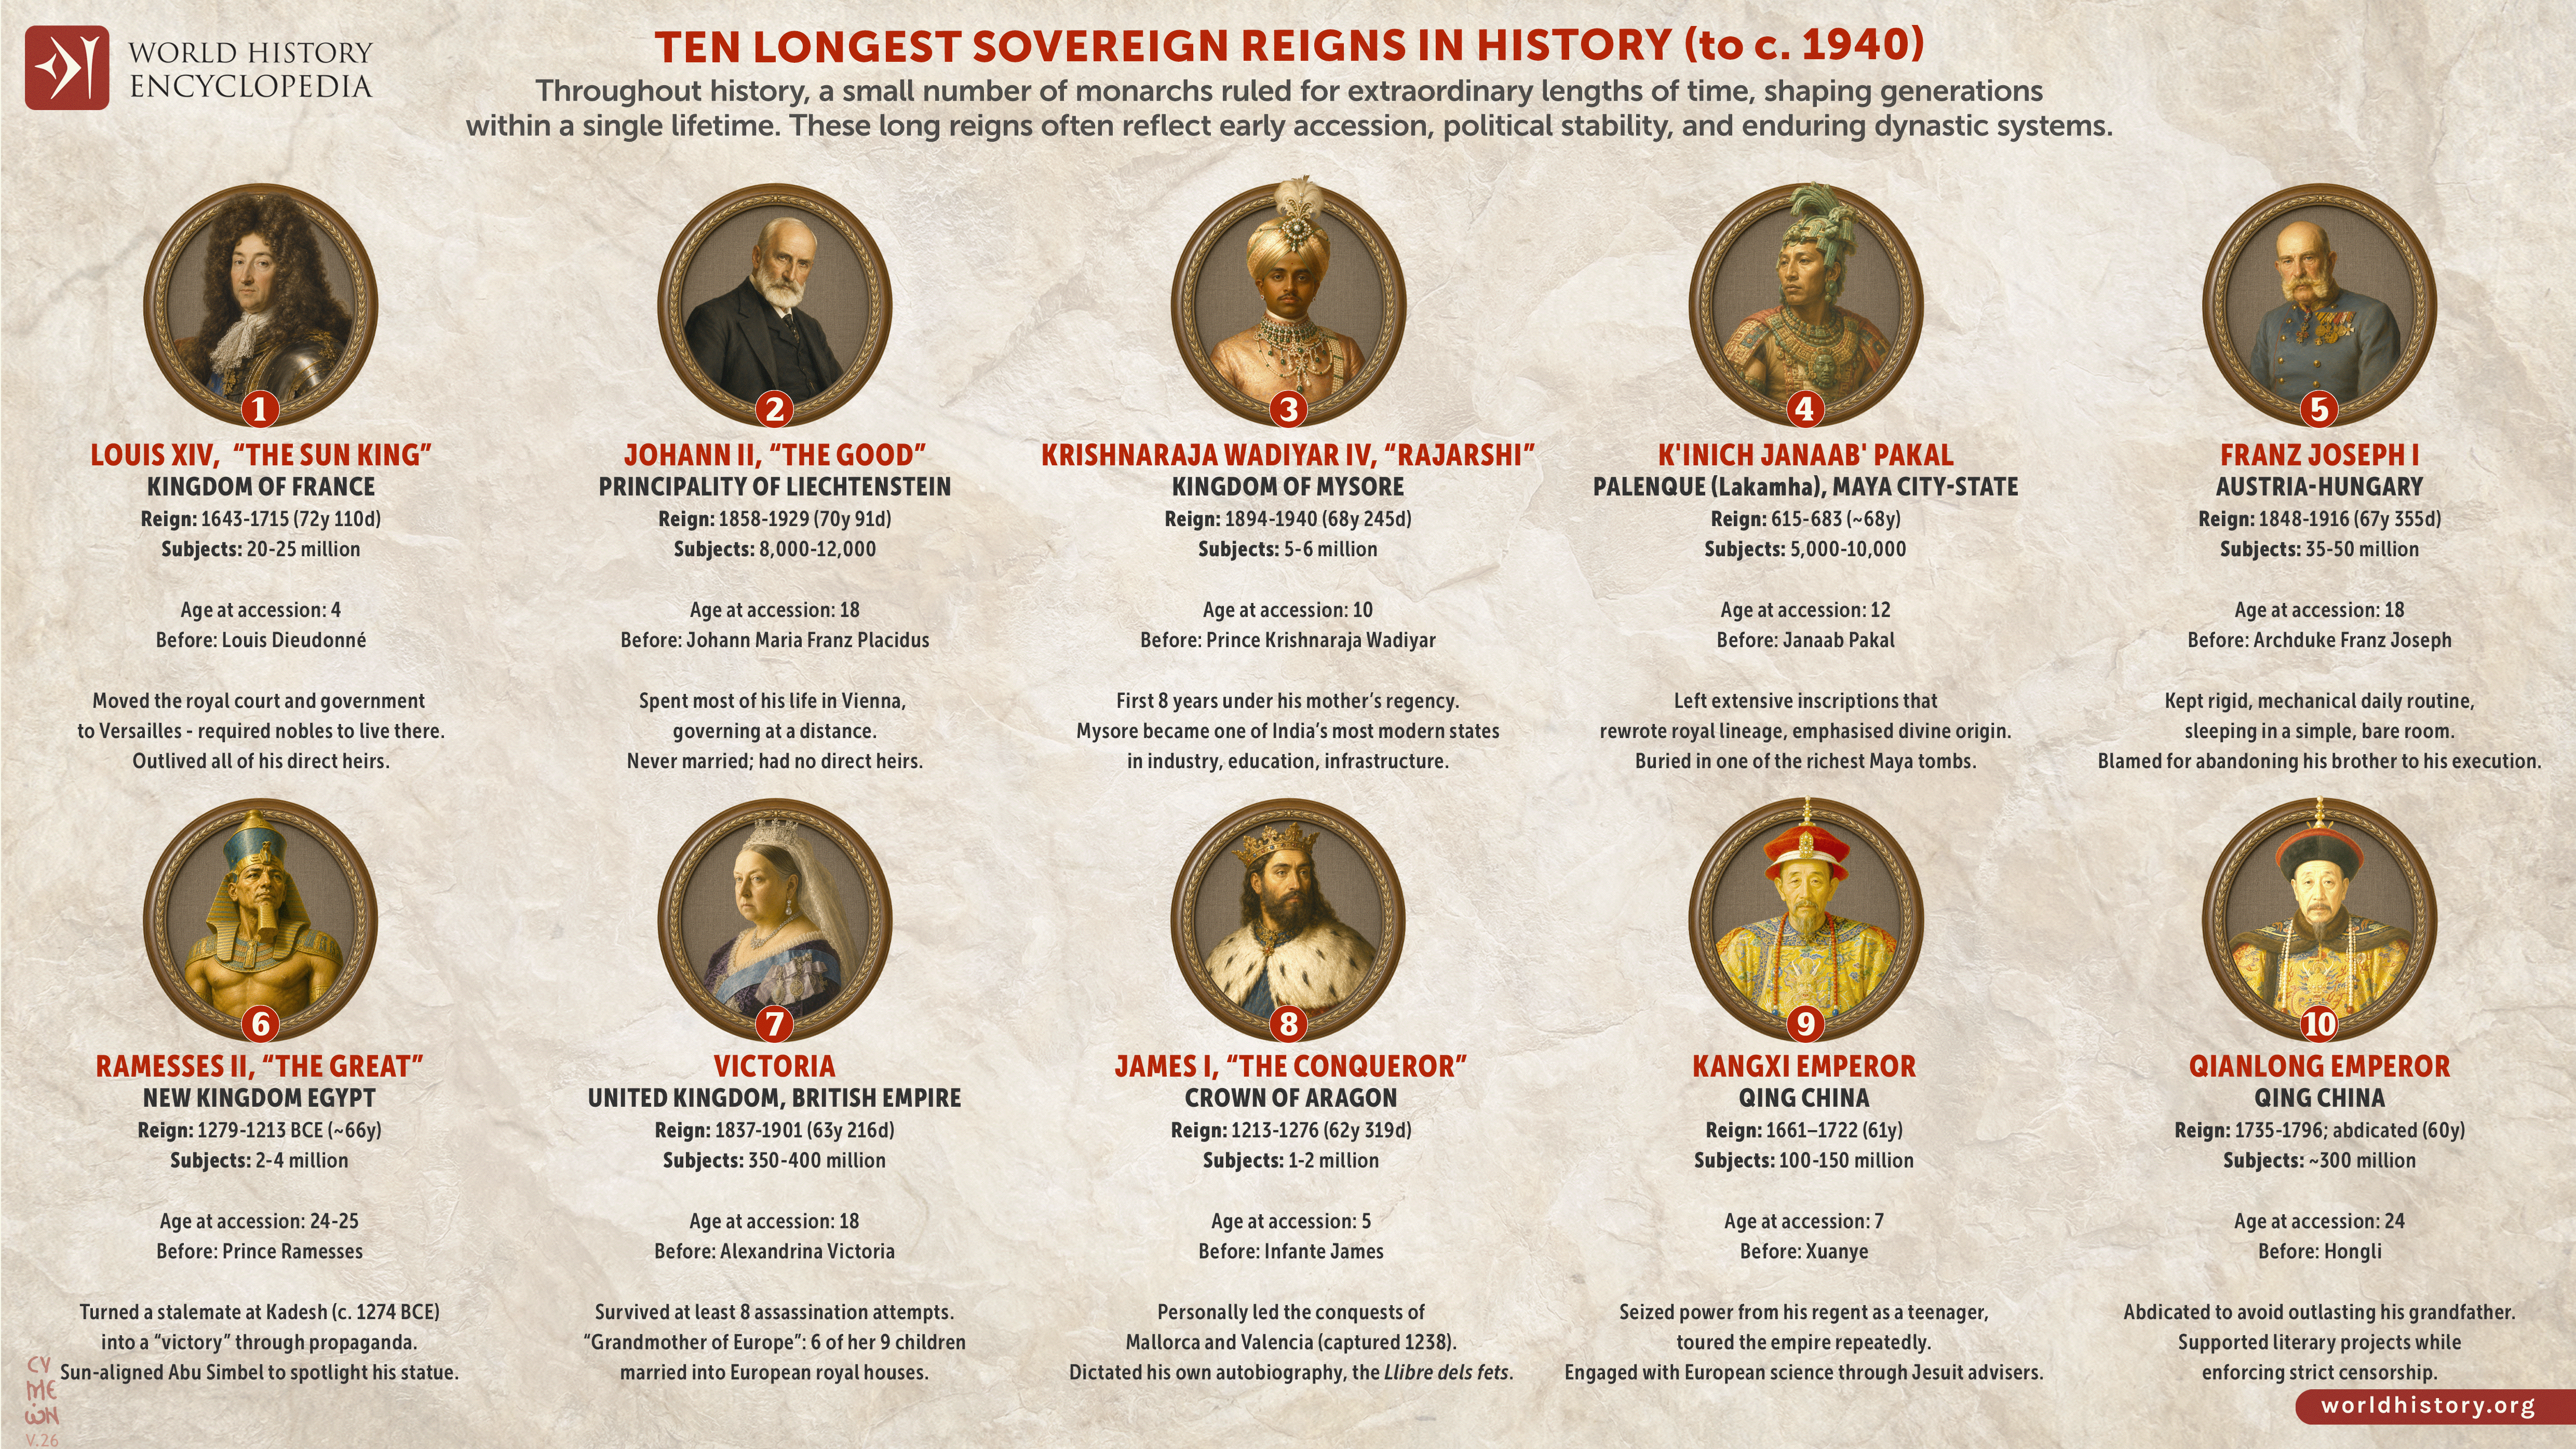
History is filled with numbers: years of rule, distances travelled, armies mobilized, cities besieged, territories conquered, and generations transformed. History by the Numbers brings together a collection of visual infographics that use rankings, timelines, comparisons, and carefully selected examples to explore patterns across world history. From long-lived dynasties and imperial expansion to famous sieges, voyages of exploration, military disasters, technological change, and religious history, each infographic turns complex historical subjects into an accessible visual story.
The numbers, however, are only the starting point. Behind every ranking or comparison lie different political systems, geographic conditions, technologies, societies, and historical circumstances that cannot be reduced to statistics alone. Designed for students, educators, and curious readers, this collection combines quantitative comparison with historical context to encourage a deeper understanding of scale, continuity and change, cause and consequence, and historical significance across different periods and regions of the human past.